Price Trends
Updated on March 6, 2020
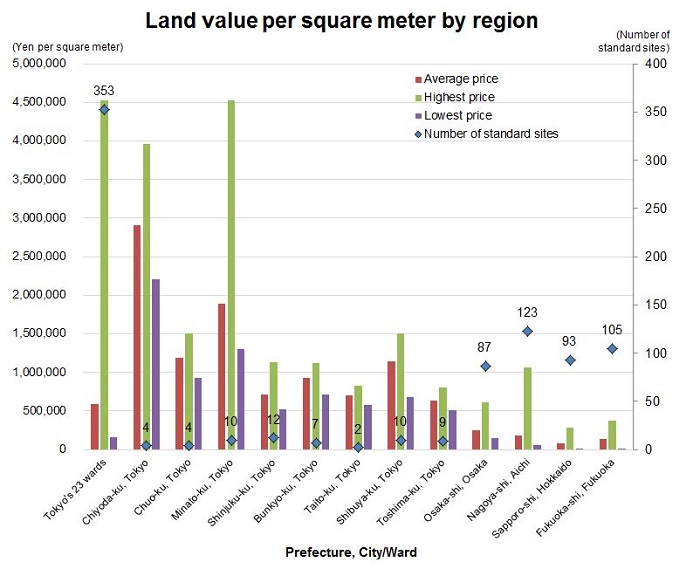
Land value per square meter by region
As of March 6, 2020
(Yen per square meter)
Source: Prepared by International Interface based on the “Publication of Market Values of Standard Sites by Prefectural Government 2019” (Ministry of Land, Infrastructure, Transport and Tourism)
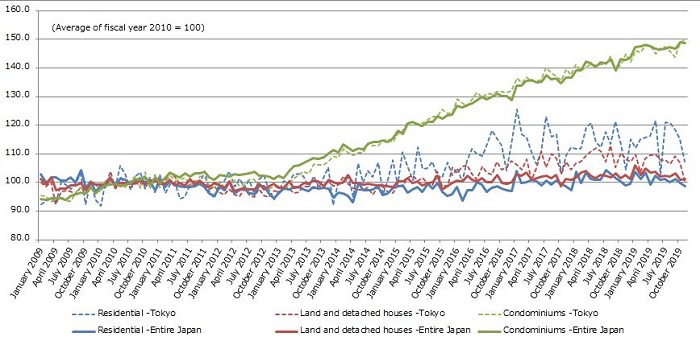
Residential Property Price Index

Source: Residential Property Price Index up to November 2019, published February 26, 2020 by the Ministry of Land, Infrastructure, Transport and Tourism
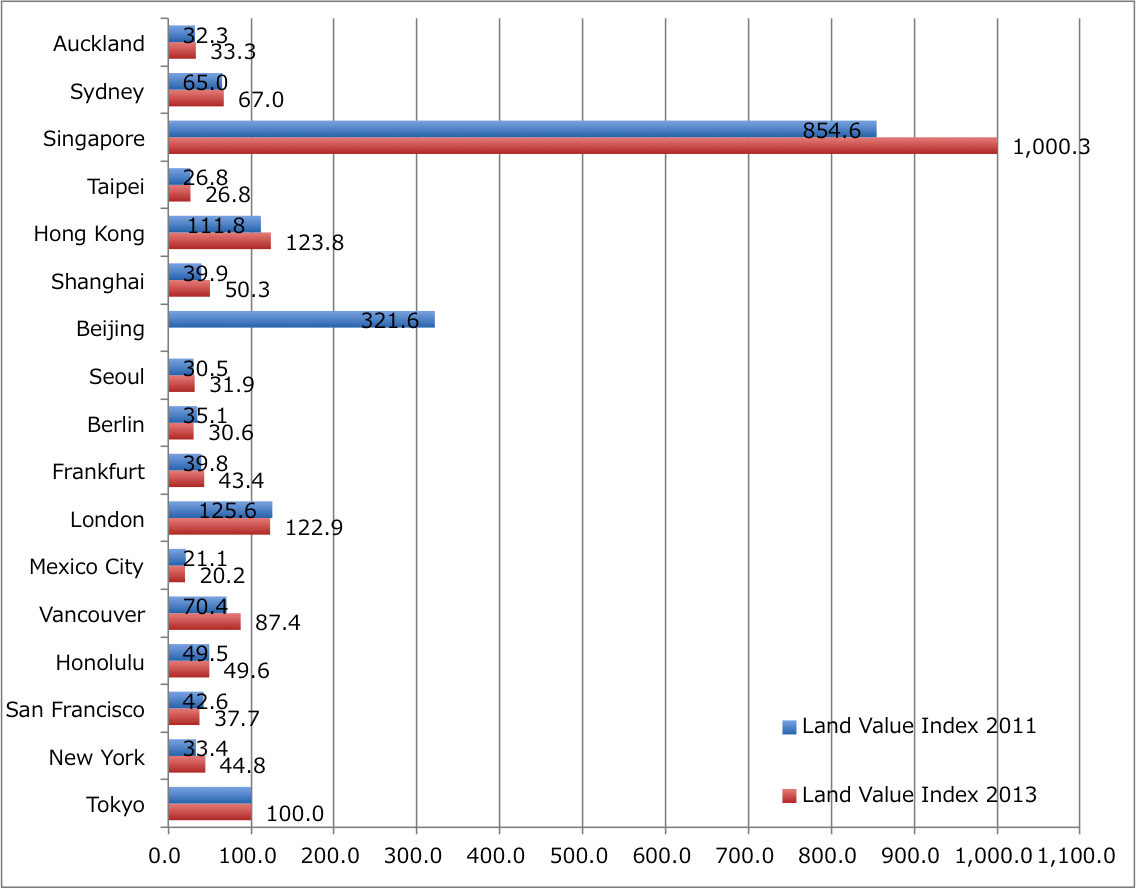
Comparison with land value per square meter in other countries

Source: Prepared by International Interface based on the “World Land Value Survey of 2013” conducted by the Japan Association of Real Estate Appraisers
Comparison with residential value in other countries

Source: Prepared by International Interface based on the “World Land Value Survey of 2013” conducted by the Japan Association of Real Estate Appraisers
Visit realestatelistings.jp for more data & market insights.


