殖利率趋势
(Updated on April 10, 2020)
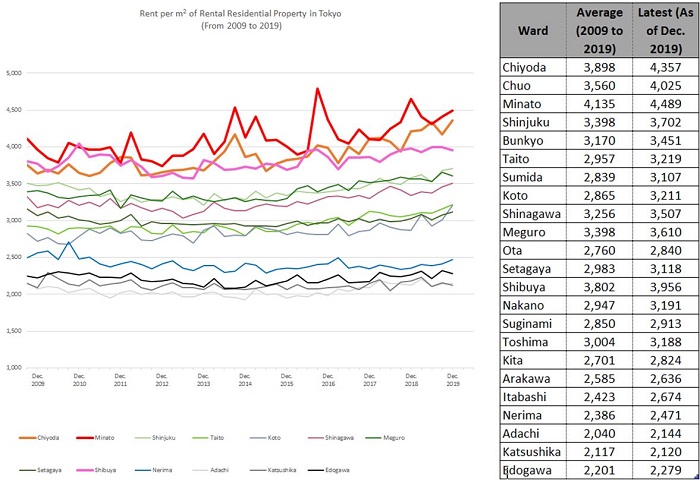
Rent per square meter of residential rental property
Rent per m2 of Rental Residential Property in Tokyo (From 2009 to 2019)
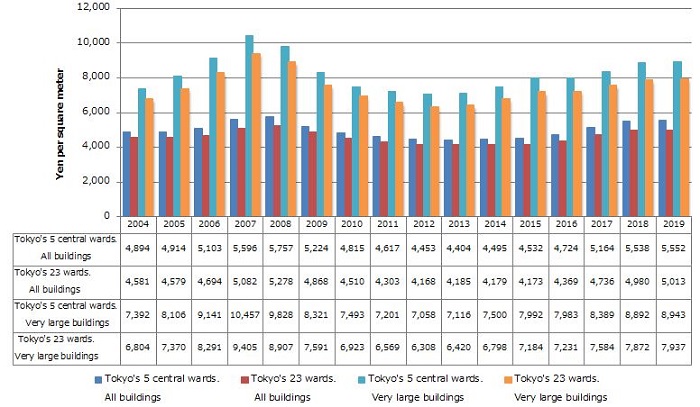
Rent per square meter and vacancy rate of rental office property
Rent per Square Meter of Rental Office Property in Tokyo's 5 Central Wards / 23 wards (From 2004 to 2019)
<Notes>
(1) Very large buildings are those with standard floor area of at least 200 tsubo. (1 tsubo = approx. 3.305 ㎡)
(2) Tokyo's 5 central wards are Chiyoda-ku, Chuo-ku, Minato-ku, Shinjuku-ku, and Shibuya-ku.
Source: Prepared by International Interface based on data published by the Ministry of Land, Infrastructure, Transport and Tourism, March 2019.
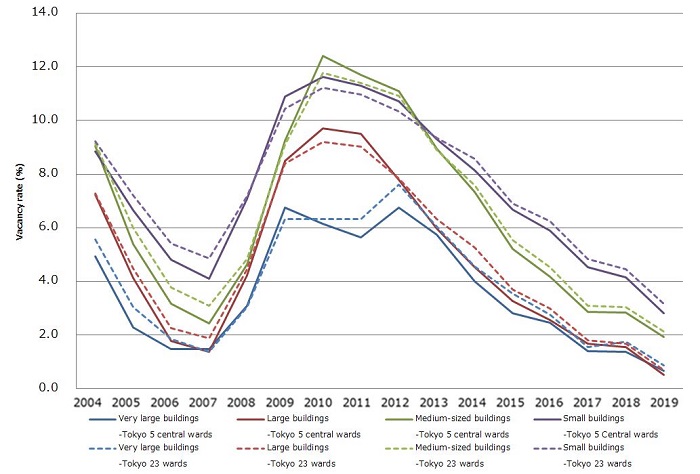
Vacancy Rate by Size for Rental Office Property in Tokyo
<Notes>
(1) Very large buildings are those with standard floor area of at least 200 tsubo. (1 tsubo = approx. 3.305 ㎡)
(2) Tokyo's 5 central wards are Chiyoda-ku, Chuo-ku, Minato-ku, Shinjuku-ku, and Shibuya-ku.
Source: Prepared by International Interface based on data published by the Ministry of Land, Infrastructure, Transport and Tourism, March 2019.
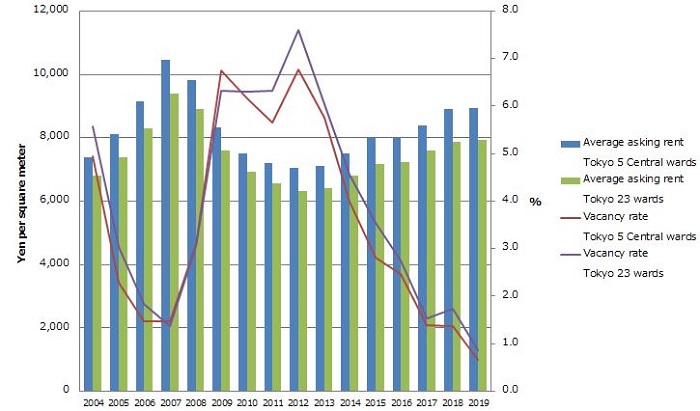
Rental Office Property in Tokyo's 5 Central Wards / 23 wards (Very large buildings) Average Asking Rent and Vacancy Rate
<Notes>
(1) Very large buildings are those with standard floor area of at least 200 tsubo. (1 tsubo = approx. 3.305 ㎡)
(2) Tokyo's 5 central wards are Chiyoda-ku, Chuo-ku, Minato-ku, Shinjuku-ku, and Shibuya-ku.
Source: Prepared by International Interface based on data published by the Ministry of Land, Infrastructure, Transport and Tourism, March 2019.
Rent comparison with major global cities
Standard Office Rent in Major Cities (As of April 2016)

Notes:
(1) Comparative index of unit rental price for each city based on premium office space located in city center. (Tokyo’s Marunouchi/Otemachi area in April 2016 = 100.0)
(2) Comparative index of unit rental price for each city based on high-end condos in each city. (Tokyo’s Moto Azabu area in April 2016 = 100.0)
Rate of Change from Preious Survey in Office Rent Index for major cities

Note: Comparison with previous survey, using indices based on appraisal of rent per 1 m2 assuming the subject property would be newly leased as of either April 1 or October 1 each year.
Source: Prepared by International Interface based on survey results of the Third “Global Property Value/Rent Indices” published by the Japan Real Estate Institute.
Visit realestatelistings.jp for more data & market insights.

- 如需了解更多信息或咨询我们的服务,
請请使用下面的联系表格。 

Copyright (C) International Interface Co., Ltd. All Rights Reserved.